

Businesses run A/B tests, marketing experiments, and product optimizations daily, hoping to improve their conversion rates and make data-driven decisions. But how do you know if the observed difference in performance is real or just a random chance?
This is where statistical significance comes in. It’s the mathematical proof that your test results are reliable. Without it, you could be making changes based on fluctuations that mean nothing in the long run.
Understanding how to calculate statistical significance ensures that data, not just gut feelings, back your choices. Whether you’re analyzing marketing strategies, product sales, or user behavior, statistical significance measures help determine whether your findings are worth acting on.
In this article, we’ll cover:
- What statistical significance is and why it matters.
- How to calculate it (step by step) and interpret your test results.
- How a statistical significance calculator can simplify the process.
- Common mistakes like sample ratio mismatch can throw off your analysis.
By the end, you’ll clearly understand how to make statistically sound decisions in your business—whether you’re running A/B tests, conducting market research, or optimizing your website for better performance.
What is Statistical Significance?
Statistical significance is the mathematical way of determining whether a result is real or just random noise.
Simply, it tells you whether the observed difference between two variations is large enough to be meaningful—or if it could have happened by chance.
For example, if you test two landing pages and one seems to have a higher conversion rate, statistical significance helps you determine whether that increase is genuine or just luck.
Without statistical significance, you could act on misleading data, making business decisions that don’t actually improve performance.
-
Breaking it Down: The Key Components
To understand statistical significance measures, you need to be familiar with these core concepts:
-
Null and Alternative Hypotheses
The null hypothesis assumes no significant difference exists between the tested groups (e.g., two landing pages perform the same). The alternative hypothesis suggests there is a real difference between them.
-
Significance Level (Alpha)
This is the threshold at which we decide whether to reject the null hypothesis. The most common significance level is 0.05 (or 5%), meaning you accept a 5% chance that your result happened by random luck.
-
Confidence Level
If a test reaches a 95% confidence level, it means there’s only a 5% chance the result is due to randomness. Higher confidence levels (like 99%) reduce the risk of error but require larger sample sizes.
-
Sample Size
A larger sample size makes your test more reliable by reducing the impact of random variations.
Too small a sample, and you risk false positives or misleading results.
-
Z-score and P-value
The Z-score tells us how far the test results deviate from what’s expected under the null hypothesis.
The P-value shows the probability of obtaining the observed result if the null hypothesis were true. A P-value lower than 0.05 means the result is statistically significant.
Why Statistical Significance Matters
Without verifying statistical significance, businesses risk:
- Making changes based on false signals leading to wasted resources.
- Overestimating the impact of a test can lead to incorrect optimizations.
- Ignoring meaningful improvements because they didn’t analyze the data correctly.
How Statistical Significance is Calculated
Now that we understand statistical significance, let’s examine how to calculate it and what factors influence it.
Statistical significance is determined using observed test results, sample size, and probability measures. While online calculators can handle the math, understanding these calculations helps you make better decisions when running or analyzing A/B tests.
How To Calculate Statistical Significance
Set Your Null and Alternative Hypotheses
- The null hypothesis assumes there’s no significant difference between the groups being tested (e.g., “Changing our call-to-action button color does not impact conversion rates”).
- The alternative hypothesis assumes that there is a meaningful difference between them.
Determine Your Sample Size
- The larger the sample size, the more reliable your results.
- Small sample sizes often result in inconclusive or misleading results.
Calculate the Conversion Rates
Suppose you run an A/B test on two landing pages:
- Version A (Control) had 10,000 visitors and 500 conversions (5% conversion rate).
- Version B (Variation) had 10,000 visitors and 550 conversions (5.5% conversion rate).
This results in an observed difference of +0.5% for Version B. But is that difference statistically significant?
Find the Standard Error (SE)
Standard error helps us measure the variability in test results, calculated using the:

Where:
- p1 and p2 are Version A and B’s conversion rates, respectively.
- n1 and n2 are the sample sizes.
Calculate the Z-Score
- The Z-score helps determine how extreme the observed difference is compared to what’s expected under the null hypothesis.
- It’s calculated using:

- A higher Z-score indicates that the difference is less likely due to chance.

Determine the P-Value
- The P-value represents the probability that the observed difference happened due to random chance.
- The result is considered statistically significant if the P-value is lower than the significance level (usually 0.05).
Compare the P-Value to Your Significance Level
- If P ≤ 0.05, you reject the null hypothesis and conclude that Version B’s improvement is statistically significant.
- If P > 0.05, the difference isn’t significant, meaning you need a larger sample size, or the difference isn’t strong enough to be meaningful.
What Factors Influence Statistical Significance?
Several key factors determine whether your test results reach statistical significance or not:
Sample Size
- The more people in your test, the more reliable your data is.
- Small sample sizes lead to higher variability, making it harder to detect real differences.
- Larger sample sizes reduce the effect of randomness and increase confidence in test results.
Magnitude of Change
- If the difference between Version A and Version B is large, it’s easier to detect.
- A 0.5% increase in conversion rate might require thousands of visitors to prove statistical significance, while a 5% jump could require far fewer.
Variability in Data
- If conversion rates fluctuate significantly, more data is needed to confirm a trend.
- High-variance data (e.g., seasonal trends in different audience segments) can make it harder to detect a significant difference.
What is a Statistical Significance Calculator?
A statistical significance calculator is an online tool that automates determining whether your test results are statistically significant.
Instead of manually computing the Z-score, P-value, and confidence level, the calculator instantly determines whether the observed difference in your A/B test is meaningful or just a random chance.
How Does a Statistical Significance Calculator Work?
Most calculators require just a few inputs:
- Sample Size – The number of people (or events) in each test group.
- Conversion Rate – The percentage of users who completed the desired action in each variation.
- Confidence Level – The statistical certainty (typically 95%) you want to achieve.
Once you enter these values, the calculator runs the required statistical tests and outputs a decision:
- If the result is statistically significant, you can be confident the difference isn’t due to chance.
- If it’s not statistically significant, you need a larger sample size or a stronger difference between variations.
Why Use a Statistical Significance Calculator?
-
Saves Time
- Manually calculating statistical significance measures is complex and time-consuming.
- A calculator instantly processes the numbers, helping you make faster decisions.
-
Eliminates Human Error
- Z-score, significance level, and P-value calculations involve multiple steps where mistakes can easily occur.
- A calculator ensures accuracy, avoiding misinterpretations of results.
-
Optimized for A/B Testing & Market Research
- Most calculators are explicitly built for A/B testing, product experiments, and market research surveys.
- They simplify decision-making by showing whether a result is statistically valid.
-
Easy Interpretation
- Instead of dealing with complex null and alternative hypotheses, a calculator directly tells you whether a difference is significant.
- Some calculators suggest next steps, like increasing the sample size if significance isn’t reached.
What to Look for in a Statistical Significance Calculator
-
Supports A/B Testing for CRO & Marketing
- A good calculator should be optimized for testing variations, allowing you to compare conversion rates, click-through rates, and other performance metrics.
-
Allows Different Confidence Levels & Statistical Tests
- The ability to set 90%, 95%, or 99% confidence levels helps you adjust results based on the level of certainty you need.
- Advanced calculators also allow you to choose between different statistical tests, such as the Z-test, T-test, or Chi-square test, depending on the data type.
-
Easy Interface & Clear Result Interpretation
- The best tools don’t just show numbers—they explain what the results mean in practical terms.
- Some calculators highlight whether results are statistically significant and recommend what to do next.
Choosing the Right Statistical Significance Calculator
With so many statistical significance calculators available, it’s important to choose one that meets your testing needs. Below, we compare four popular options based on their interface, features, and usability.
-
FigPii’s A/B Test Duration Calculator
FigPii’s calculator helps users determine how long to run their A/B test for reliable results. It provides an intuitive interface where users can input key test parameters, including the original conversion rate, average daily visitors, the number of variations, expected uplift, and the desired confidence level.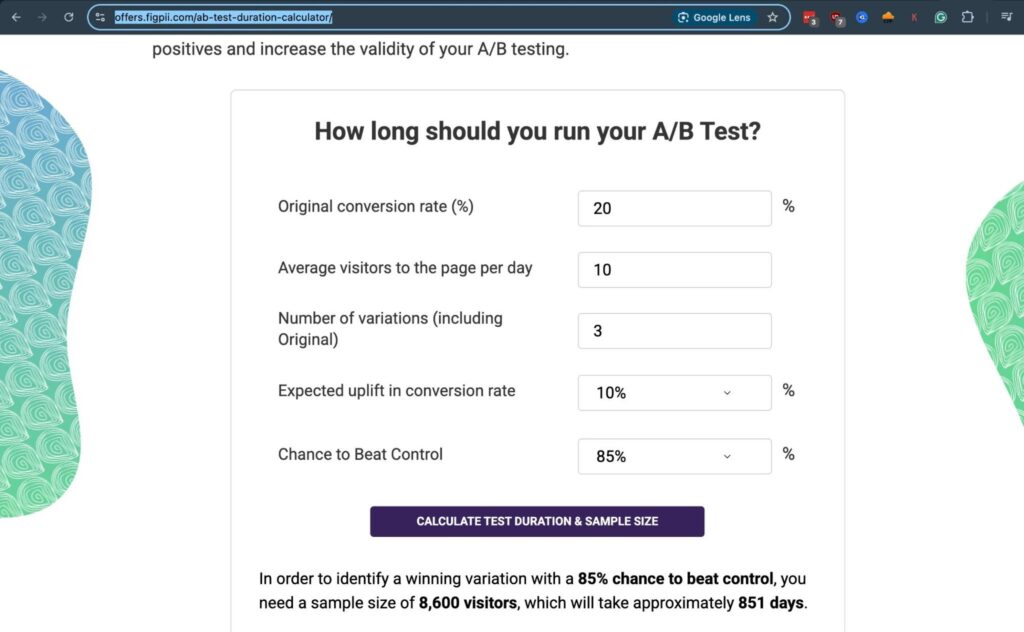
The tool then calculates the required sample size and test duration, making it a great option for conversion rate optimization professionals who need to ensure they collect enough data before making conclusions.
-
Evan Miller’s Sample Size Calculator
Evan Miller’s calculator is a go-to tool for determining the required sample size before running an A/B test. It allows users to set a baseline conversion rate and define the minimum detectable effect.
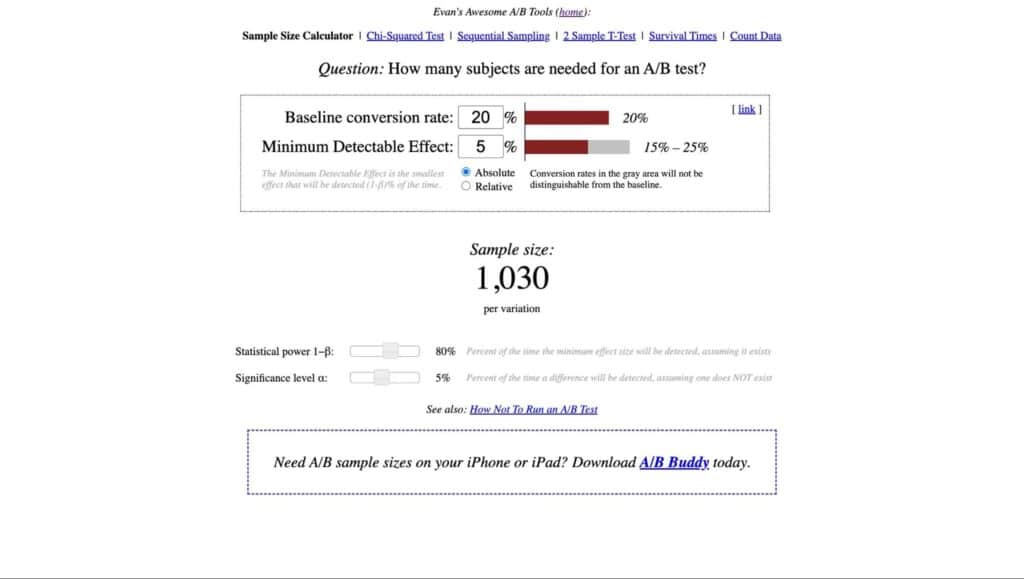
Unlike other tools, this calculator emphasizes statistical power and significance level, giving users control over how sensitive their test should be. However, its interface is more technical, making it better suited for experienced testers familiar with statistical concepts.
-
AB Testguide’s Significance Calculator
AB Testguide’s tool provides a comprehensive statistical breakdown of test results. It features an interactive graph visually representing the confidence intervals of different variations, along with detailed metrics such as observed power, standard error, and z-scores.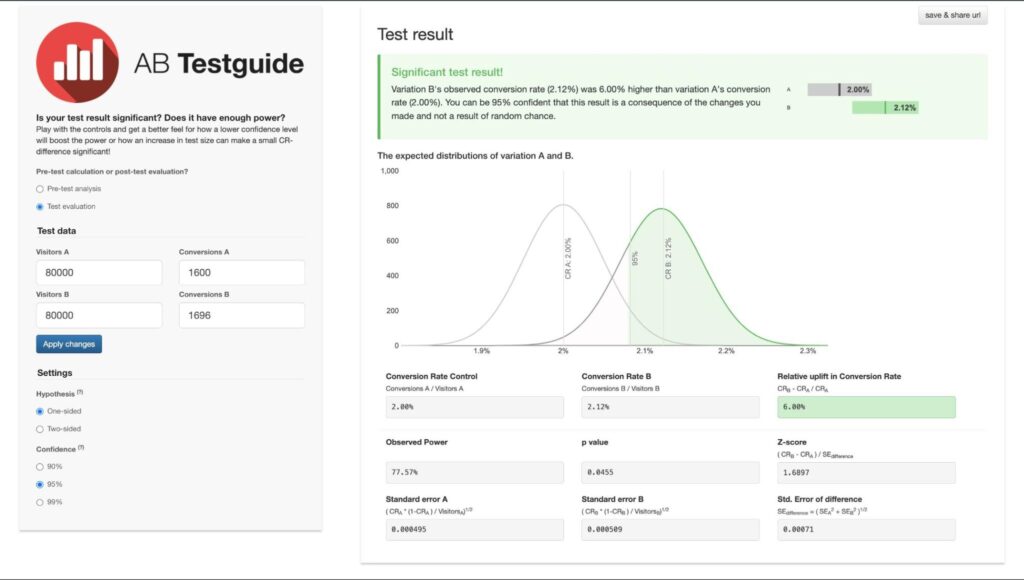
This calculator is ideal for users who want in-depth statistical insights beyond just a “significant/not significant” result. Its strength lies in post-test analysis, making it valuable for validating A/B test outcomes.
-
VWO’s A/B Testing Calculators
VWO offers two distinct calculators: one for calculating statistical significance and another for estimating test duration.
The significance calculator features a clean, user-friendly interface where users can enter the number of visitors and conversions for control and variation.
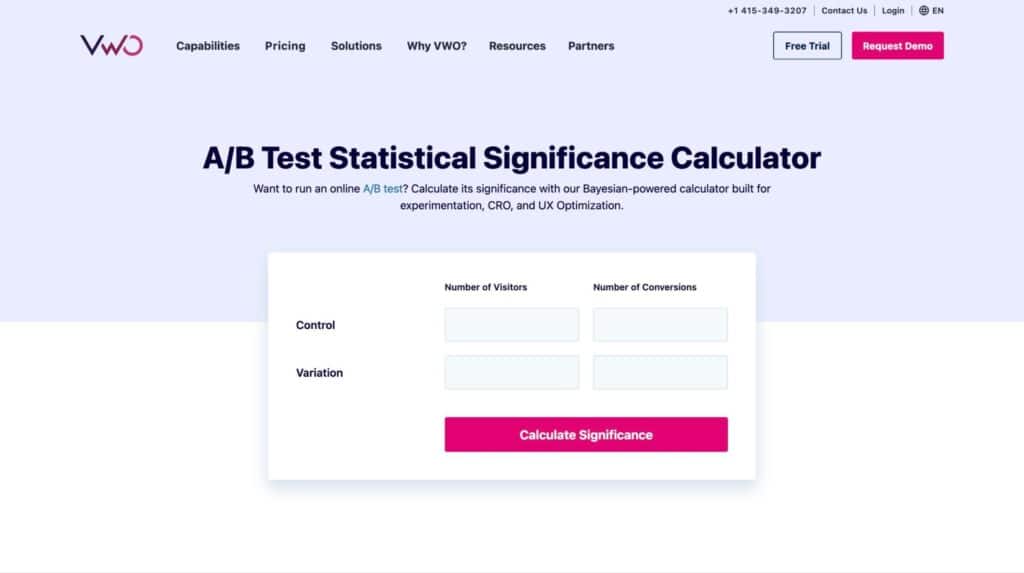
Meanwhile, the duration calculator helps users determine how long they must run their test based on expected conversion rates and uplift.

These calculators are well-suited for businesses that want a simple yet effective way to validate A/B test results without diving too deep into statistics.


Each of these tools serves a different purpose, so choosing the right one depends on your testing objectives and level of expertise.
Whether you need a quick test duration estimate, a deep statistical breakdown, or a straightforward significance check, these calculators can help streamline your A/B testing process.
Final Thoughts
A/B testing without statistical significance is like making business decisions on gut instinct alone. While achieving statistical significance confirms that test results are not due to random chance, it’s only one piece of the puzzle.
Businesses must also consider real-world factors such as customer behavior, revenue impact, and long-term trends before making final decisions.
Using a statistical significance calculator eliminates guesswork, reduces errors, and speeds up analysis, ensuring that test results are backed by solid data.
However remember, significance alone doesn’t guarantee success—what truly matters is how well test insights align with business goals.
Statistical Significance Calculator FAQs
How do you calculate statistical significance?
Statistical significance is calculated by comparing the observed difference between test groups to the expected variation under the null hypothesis. This involves computing the p-value using statistical tests such as a z-test or t-test and checking if it falls below the chosen significance level (α), typically 0.05 or 0.01. If the p-value is lower than α, the result is considered statistically significant.
When should you use 0.01 and 0.05 level of significance?
A 0.05 significance level is standard in most A/B tests and experiments, meaning there is a 5% chance the results happened by random chance. However, a 0.01 significance level is used when more confidence is required, such as in medical research or high-stakes business decisions, reducing the risk of false positives.
How do you calculate the 0.05 level of significance?
To calculate statistical significance at a 0.05 level, you determine the test statistic (e.g., z-score or t-score) and compare it against critical values for α = 0.05. If the test statistic falls within the rejection region, you reject the null hypothesis, concluding that the results are statistically significant. Most online calculators automatically handle this computation.
What is 95% statistical significance?
A 95% statistical significance means that there is only a 5% probability that the observed test results happened by chance. In other words, if the same experiment were repeated multiple times, the results would fall within the observed range 95% of the time, assuming the effect is real.

