

A/B testing is one of the most effective ways to make data-backed decisions that drive growth. But to get real value out of it, you need to measure the right things.
Running tests without tracking meaningful metrics is like setting out on a road trip with no map—you might eventually get somewhere, but the journey will be aimless, inefficient, and full of wrong turns.
The right A/B testing metrics help you understand what’s working, what’s not, and where you should focus your optimization efforts.
They tell you more than just which variation won—they reveal the why behind user behavior, allowing you to confidently refine your strategies.
In this article, we’ll discuss the key A/B testing metrics you should track, how to choose the right ones based on your business objectives, and how to use these insights to improve your website or app continuously.
What are A/B Testing Metrics?
A/B testing metrics are the measurable data points used to evaluate the performance of different variations in an A/B test.
These metrics help determine which version of a webpage, ad, email, or app element is more effective in driving desired user actions.
Unlike A/B testing goals, which define the overarching objectives of an experiment, metrics provide the data needed to analyze performance and make informed decisions.
Selecting the right metrics depends on what you’re testing and your overall business objectives. Some tests may prioritize engagement metrics, while others focus on revenue impact.
Important A/B Testing Metrics to Track
Tracking the right metrics in A/B testing ensures that decisions are based on actual user behavior rather than assumptions.
Each metric provides insight into how variations impact performance and helps determine whether changes should be fully implemented.
Primary vs. Secondary A/B Testing Metrics
A/B testing metrics can be categorized into primary metrics (those that directly measure the success of a test based on business goals) and secondary metrics (those that provide supporting insights to explain why a test performs the way it does).
Primary A/B Testing Metrics
These metrics directly measure whether an A/B test achieves the desired outcome. They are the core indicators of success and typically align with key business objectives.
-
Conversion Rate
Conversion rate is one of the most important A/B testing metrics. It measures how many visitors take a desired action, such as purchasing, signing up, or completing a form.
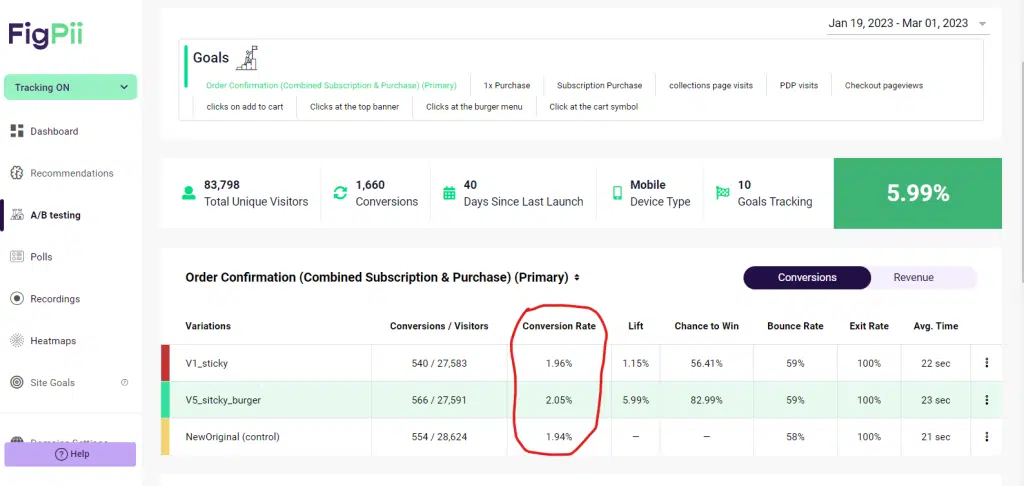
If a test variation increases conversions, it indicates that the change positively influences user behavior.
However, an increase in conversion rate alone doesn’t always mean success—it’s vital to assess whether those conversions align with business goals and long-term customer value.
-
Cart Abandonment Rate
The cart abandonment rate is one of eCommerce businesses’ most valuable A/B testing metrics. A high abandonment rate means users add products to their cart but do not complete the purchase.
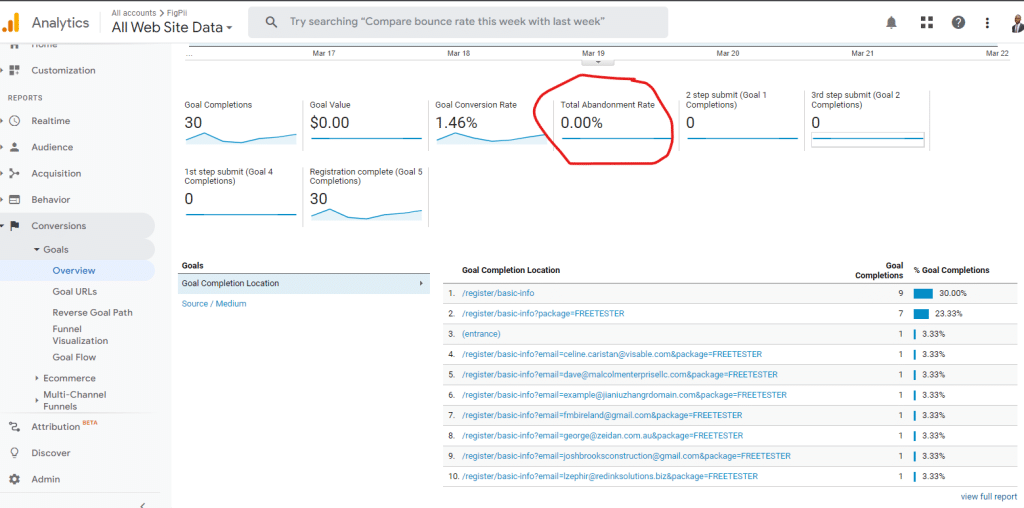
Testing different checkout flows, payment options, or shipping incentives can help identify changes that make the process smoother.
A drop in abandonment rate often signals reduced friction points, leading to more completed purchases.
-
Retention Rate
The retention rate tracks how many users return to your website or app over time. For A/B testing, the retention rate is critical when testing onboarding flows, loyalty programs, or user experience improvements.
A successful test variation should improve immediate conversions and encourage long-term engagement. If a test boosts short-term sign-ups but leads to lower retention, it may indicate that expectations were unmet during the initial experience.
-
Average Order Value (AOV)
AOV measures the average amount spent per order. In A/B testing, increasing AOV is often a goal when a/b testing pricing strategies, product bundling, or promotional offers.
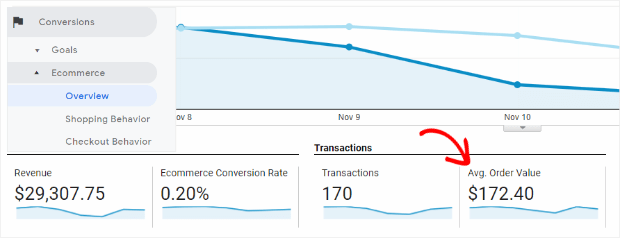
If a variation encourages users to buy more expensive items or add complementary products, AOV will increase. However, AOV should be balanced with conversion rate—if AOV rises but conversions drop significantly, it could indicate that pricing changes are discouraging some customers.
-
Revenue Per Visitor (RPV)
RPV measures the average revenue generated per user visit. It provides a broader view of how an A/B test impacts profitability by combining conversion rate and purchase value.
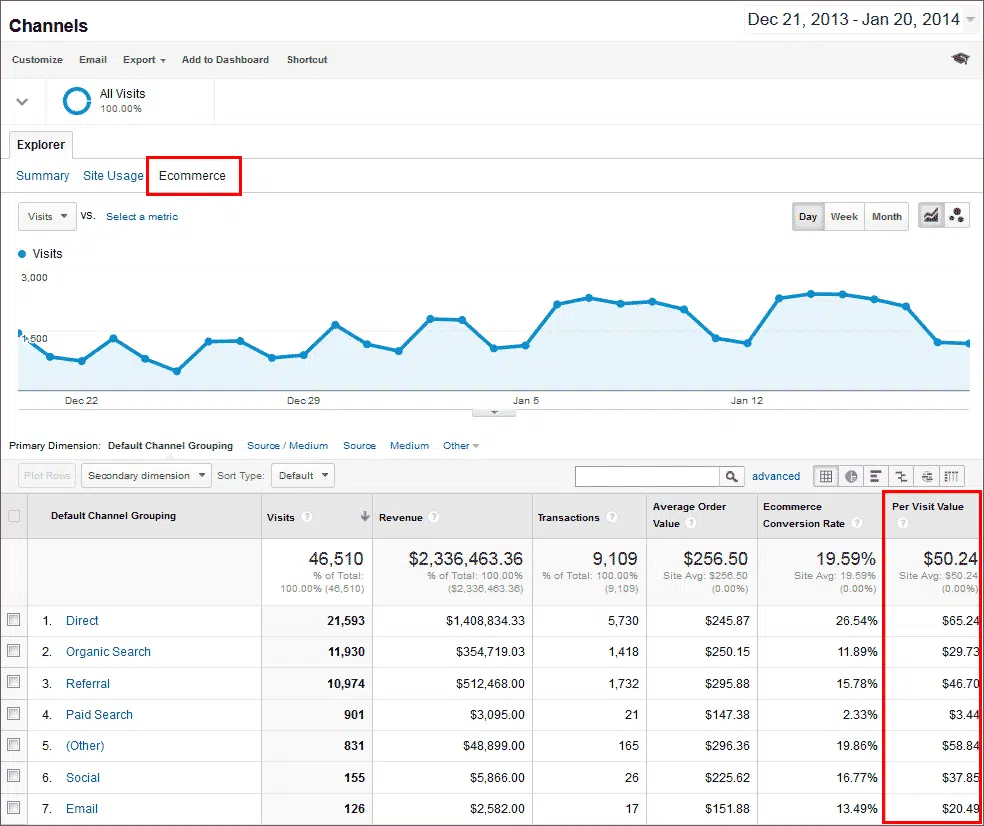
If a test variation improves conversion rate but leads to lower RPV, it may indicate that customers are purchasing lower-value items.
Conversely, if RPV increases without a major shift in conversion rate, it suggests that upselling or pricing adjustments are effective.
Secondary A/B Testing Metrics
These metrics help explain test results by providing additional insights into user behavior and engagement. They don’t directly indicate success, but help refine hypotheses for future testing.
-
Click-Through Rate (CTR)
CTR measures how many users click on a specific element, such as a call-to-action button, ad, or email link. In A/B testing, CTR is particularly useful for evaluating whether a headline change, ad copy, or CTA design encourages more engagement. If click-through rate improves but conversion rates remain stagnant, it suggests that users are clicking but not finding what they expect on the next page, requiring further refinement.
-
Bounce Rate
A high bounce rate means users are leaving a page without interacting further. In A/B testing, reduced bounce rates can indicate that the variation is better at keeping users engaged.
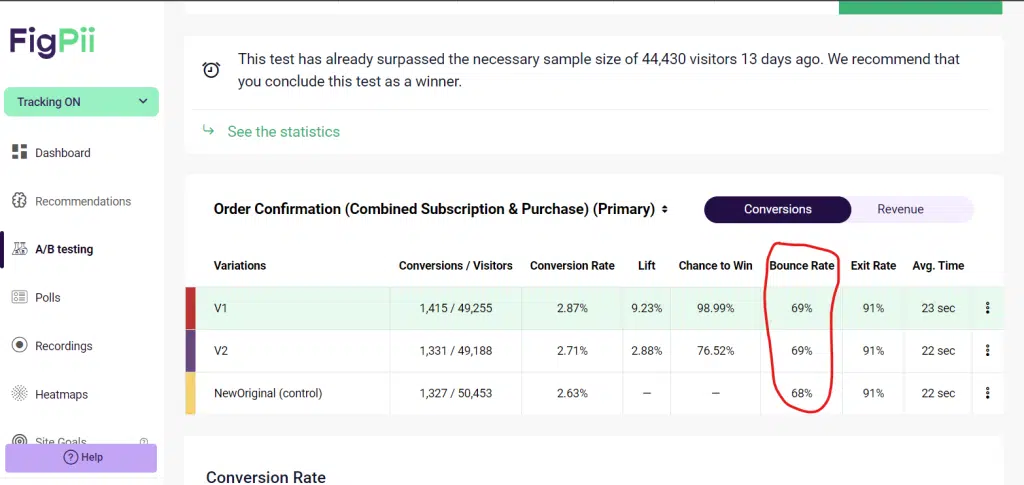
However, a lower bounce rate without an increase in conversions may suggest users are staying longer but not finding what they need.
Understanding why users leave—whether due to slow load times, poor messaging, or irrelevant content—helps in making more effective optimization decisions.
-
-
Engagement Metrics (Scroll Depth, Button Clicks, etc.)
-
Engagement metrics provide micro-level insights into user behavior during an A/B test. Scroll depth helps determine how much of a page users read, while button clicks show interaction levels with CTAs or navigation elements.
These metrics are particularly useful when testing blog layouts, product descriptions, or feature placements. If users scroll further or interact more with key elements, it suggests that the variation is improving engagement.
-
Session Duration (or Average Time on Page)
Session duration measures how long a user spends on a website, while average time on page focuses on specific pages.
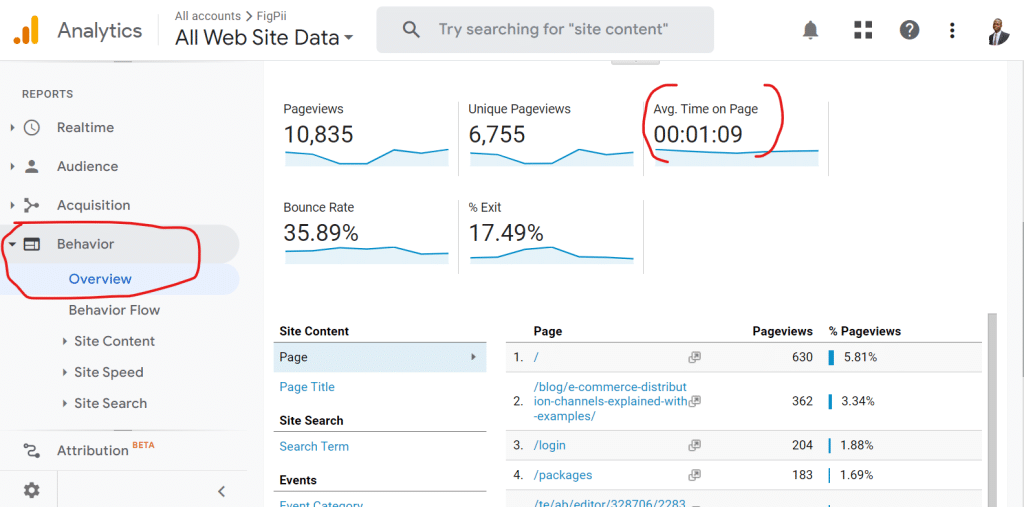
These metrics help assess whether content changes improve user engagement in A/B testing. Users may struggle to find key information if a variation leads to longer session durations but lower conversions.
Testing layout, navigation, or messaging adjustments can help create a better balance between engagement and action.
How to Choose the Right A/B Testing Metrics?
Choosing the right A/B testing metrics ensures you measure what truly matters.
A poorly chosen metric can lead to misleading conclusions, wasted resources, or even decisions that hurt performance.
Here’s how to select the right metrics for your experiment:
-
Align with Business Objectives
Your A/B testing metrics should reflect your broader business goals. If you’re focused on increasing revenue, tracking conversion rates, average order value, or revenue per visitor makes sense.
If engagement is the priority, click-through rates, session duration, or interactions per visit should take center stage. Every test should be tied back to a measurable business outcome.
-
Identify Pain Points
A/B testing should solve a specific problem or improve a user experience. Look at analytics, heatmaps, and session recordings to pinpoint where users struggle.
If users drop off during checkout, track checkout completion rates. If engagement is low on a landing page, track time on page or CTA clicks. The metrics should directly address the friction points in your user journey.
-
Choose Primary and Secondary Metrics
Your primary metric is the main indicator of success. It should be clear, quantifiable, and directly tied to the test’s goal.
However, relying on a single metric can be misleading, so supporting (secondary) metrics provide context.
For example:
- Primary Metric: Conversion Rate (measures the effectiveness of a landing page)
- Secondary Metrics: Bounce Rate (indicates if users leave too soon), Click-Through Rate (measures engagement before conversion)
-
Consider the User’s Journey
Metrics should be relevant to the specific funnel stage you’re optimizing. If you’re testing a homepage design, engagement metrics like click-through rate or time on page might be the most valuable.
The cart abandonment rate or average order value is more relevant for checkout optimization. The right metric depends on where users are in their journey and what action you want them to take.
-
Balance Quantitative and Qualitative Data
While numbers are important, they don’t always tell the full story. A test may show increased conversions, but session recordings or user feedback might reveal usability issues that could impact long-term retention.
Combining quantitative data (like conversion rates) with qualitative insights (like user surveys or heatmap analysis) provides a well-rounded view of how changes impact user behavior.
How to Get the Most Out of A/B Testing Metrics
Tracking A/B testing metrics is more than just gathering numbers. It’s about interpreting and using the data to drive meaningful changes. A structured approach ensures accuracy, reliability, and actionable insights that lead to real improvements.
-
Set Up Clear Tracking with Analytics Tools
Before running an A/B test, ensure you have the right tools in place to track and measure key metrics. Platforms like Google Analytics, FigPii, or Mixpanel can help monitor user interactions, conversions, and engagement.
Define the specific events, clicks, and behaviors you need to track, and set them up properly to avoid missing critical data points. Poor tracking can lead to misleading results and wasted testing efforts.
-
Ensure Statistical Significance Before Making Conclusions
One of the biggest mistakes in A/B testing is making decisions too soon. Just because a variation shows an initial improvement doesn’t mean it will hold over time. Statistical significance ensures results are not due to random chance.
Use tools that calculate significance levels and establish a minimum sample size before drawing conclusions. This prevents premature decisions based on unreliable early trends.
-
Avoid Metric Fixation and Focus on Holistic Test Insights
It’s easy to focus too much on a single metric, like conversion rate, while ignoring other signals. However, looking at multiple metrics together provides a clearer picture of user behavior.
For example, an increase in conversions might come with higher cart abandonment or lower retention.
Always cross-check primary and secondary metrics to ensure that improvements in one area aren’t causing negative trade-offs elsewhere.
-
Iterate Based on Data Rather Than Assumptions
The goal of A/B testing is not just to get one winning variation but to continuously improve. Use the insights from each test to refine your approach, create new hypotheses, and test again.
If a test fails, analyze why and adjust accordingly instead of abandoning testing altogether. The best optimization strategies build on an iterative process, where each test informs the next.
By following these principles, you can ensure that your A/B testing efforts lead to real improvements rather than just surface-level changes.
Final Thoughts
A/B testing is only as effective as the metrics you track. Selecting the right metrics allows you to measure the direct impact of changes, optimize user experiences, and confidently refine your strategies.
While metrics provide data on specific elements of your experiment, KPIs tie those insights to your broader business goals, ensuring that every test serves a meaningful purpose.
Frequently Asked Questions
What metrics are most important to track in an A/B test?
The most important metrics depend on your goals. If you're optimizing for conversions, focus on conversion rate, click-through rate (CTR), and bounce rate. For engagement-focused tests, time on page, scroll depth, and interaction rate are key. Revenue-driven tests should track average order value (AOV), revenue per visitor (RPV), and customer lifetime value (CLV). Always align your metrics with your business objectives.
How do I choose the right metrics to measure in an A/B test?
Start by identifying the primary goal of your test. If you’re testing a call-to-action button, click-through rate might be your primary metric. If you're testing checkout improvements, cart abandonment rate is crucial. Consider secondary metrics that provide context, such as bounce rate, session duration, or engagement rate. Choose metrics that reflect meaningful user behavior and align with long-term business objectives.

