

Google Analytics is one of the most popular web analytics tools, and millions of websites use it. The free quantitative analytics tool has a large user base and a rich ecosystem of resources, tutorials, guides, and experts.
Its integration with other Google products and services like Ads, Search Console, Data Studio, and more made it even more compelling.
Why look for a Google Analytics alternative?
First and foremost, Google Analytics is shutting down its previous version (Universal Analytics) and replacing it with a new version (Google Analytics 4) with a different data model and features. There’s also a lack of historical data import from Universal Analytics.
Google Analytics 4 is the latest version of Google Analytics that represents a new approach to data modeling and analysis. It uses an event-based model that tracks user interactions across devices and platforms, machine learning, and AI to provide insights and predictive analytics.
Google Analytics 4 is free for most websites (up to 10 million monthly hits).
However, GA4 also has some limitations and drawbacks.
With increasing emphasis on data privacy, businesses seek alternatives to Google Analytics that prioritize user anonymity and data protection and comply with stricter privacy regulations (including GDPR and CCPA).
Moreover, relying solely on one analytics platform can limit insights and hinder the ability to make data-driven decisions. Exploring alternatives allows businesses to diversify their analytics tools, gain different perspectives, and reduce dependency on a single provider.
Some businesses require more flexibility and control over their analytics data, including the ability to customize tracking parameters, integrate with specific tools, or have an open-source codebase for transparency.
Keeping all this in mind, we reviewed some of the best Google Analytics alternatives that address these concerns, empowering businesses to make informed decisions based on their unique requirements.
1. Adobe Analytics
Adobe Analytics is one of the first names that comes to mind when discussing alternatives to Google Analytics. Like Google Analytics, Adobe’s analytics tool gives you insights into user behavior and website performance and lets you create custom reports and define KPIs.
One of Adobe Analytics’ standout features is processing data and updating reports in real-time. It lets you modify or delete historical data using built-in tools like Data Warehouse, Data Workbench, etc.
If you want to create more complex and advanced reports, Adobe Analytics has tools like Analysis Workspace, Report Builder, and Ad Hoc Analysis. These tools also help you set up reports with unlimited metrics and dimensions.
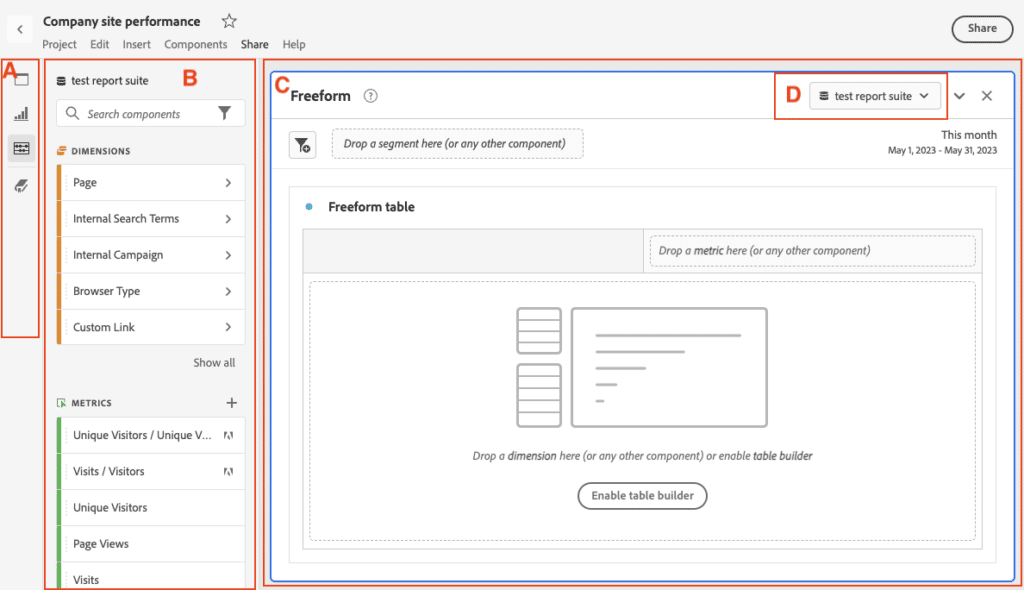
 Adobe Analytics workspace overview
Additionally, Adobe Analytics offers cross-channel tracking, giving you a holistic view of user interactions across multiple touchpoints. For example, you can analyze how users move between channels like websites, mobile apps, social media, and offline interactions.
Other key features include:
- Segmentation and Personalization: Adobe Analytics allows you to segment your audience based on various attributes and behaviors. You can create targeted segments for marketing campaigns and personalize the user experience to improve engagement and conversions.
- Attribution Modeling and Optimization: You can utilize attribution models to determine the impact of different marketing channels on your business goals. This helps optimize your marketing mix and budget allocation.
- Path Analysis: Adobe Analytics lets you analyze user paths and flow through your website or app. This feature helps identify potential bottlenecks, drop-off points, and areas for improvement to optimize the user journey.
Pros:
- Adobe Analytics offers a wide range of advanced analytics features and tools, allowing you to dive deep into data and gain valuable insights.
- Adobe Analytics integrates with various data sources, such as websites, mobile apps, CRM systems, and advertising platforms. It collects data using JavaScript tags or SDKs and consolidates it for analysis.
- Adobe Analytics seamlessly integrates with other solutions in the Adobe Marketing Cloud suite, allowing for a unified marketing analytics and optimization workflow.
- You can use Adobe’s Experience Platform or Adobe Sensei to analyze your data using AI.
Cons:
- The advanced features can make it complex for beginners, requiring a whole learning curve to utilize its potential.
- Setting up and configuring Adobe Analytics may require more time and resources than simpler analytics tools.
- Adobe Analytics is considered a high-end and costly solution, especially for smaller businesses or those with limited budgets.
Pricing:
Contact Adobe or their sales team for a tailored quote to get pricing details.
2. Mixpanel
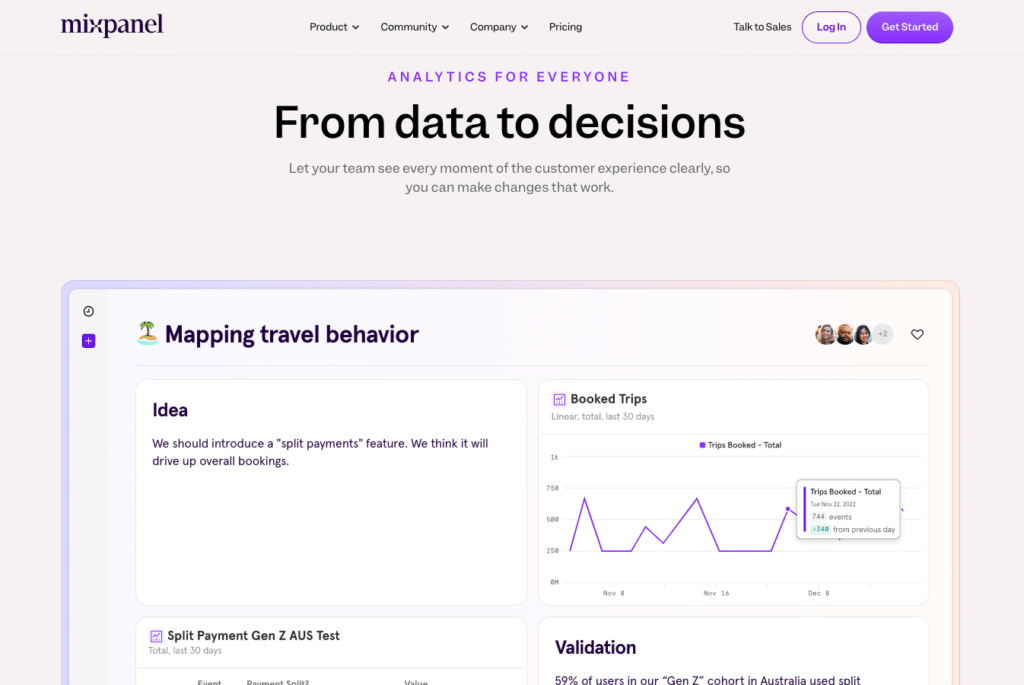
Mixpanel is an event analytics solution that allows you to analyze how users interact with your Internet-connected product.
Since the platform is built around event-based analytics, it focuses on tracking and analyzing specific user actions or events rather than relying solely on pageviews. This allows businesses to gain granular insights into user behavior and understand the effectiveness of various actions and features.
Another standout feature is Mixpanel’s people analytics feature that helps you track individual user behavior – enabling personalized targeting and a better understanding of user lifecycles. It helps create user profiles, segment users based on their actions and attributes, and analyze their engagement patterns.
Other key features include:
- Funnel Analysis: Funnel analysis capabilities allow you to define and track conversion funnels, identifying the steps users take before completing a desired action.
- Retention Analysis: You can track how well you retain users over time. It helps identify patterns, understand user loyalty, and evaluate the effectiveness of retention strategies.
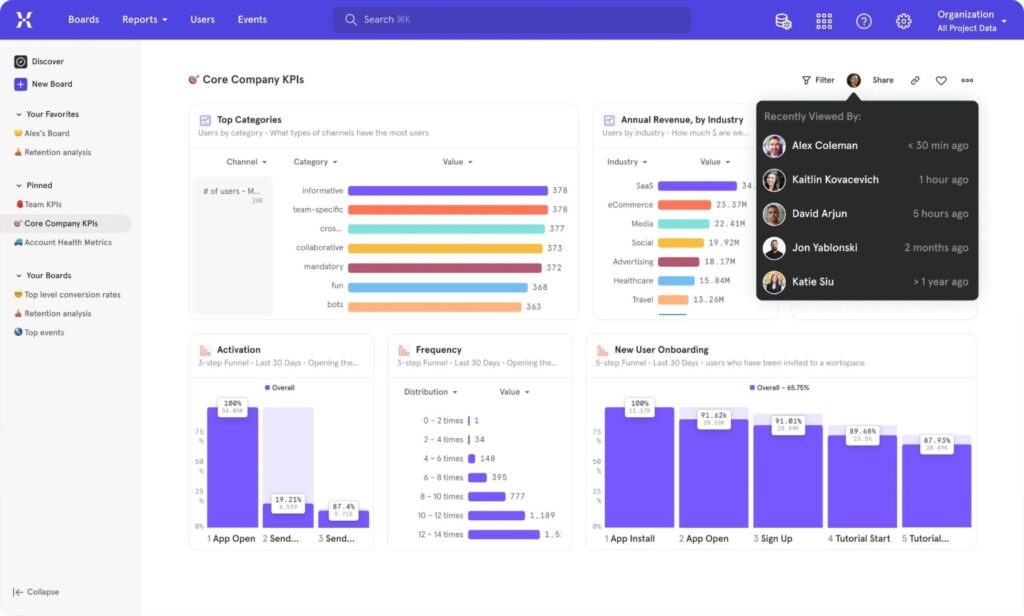
- Custom Dashboards: Mixpanel lets you create custom dashboards to monitor key metrics and share them with your team. You can also use pre-built dashboards for everyday use cases like acquisition, engagement, and retention.
Pros:
- It lets you explore data freely without SQL. You can measure growth and retention, slice and dice data to uncover trends and see live updates on how people use your product.
- It offers a scalable infrastructure that grows with your data volume. You don’t have to worry about performance issues or data limits as your product grows.
- Mixpanel lets you segment your users based on various attributes and behaviors, enabling a more targeted analysis, understanding different user cohorts, and tailoring strategies.
Cons:
- It may require a steep learning curve and technical support to set up and use effectively.
- Mixpanel does not have an auto-track option. You have to manually define every event and property you want to track.
Pricing:
Starts at $20 per month for about 10k events (when billed annually). There’s also a free plan for up to 20M monthly events.
3. Woopra
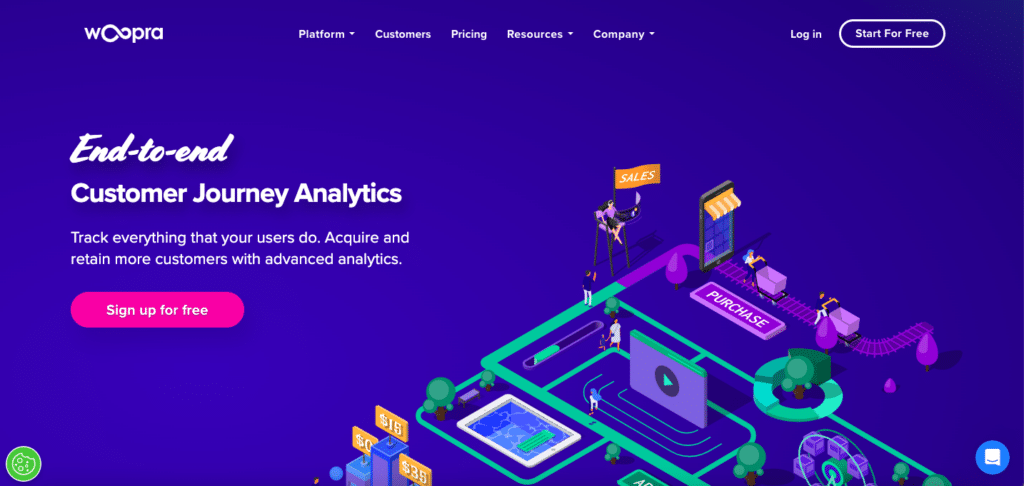
 Woopra is a customer journey analytics platform that helps you understand and optimize every touchpoint in the customer experience. It tracks and analyzes user behavior across web, mobile, email, and other channels.
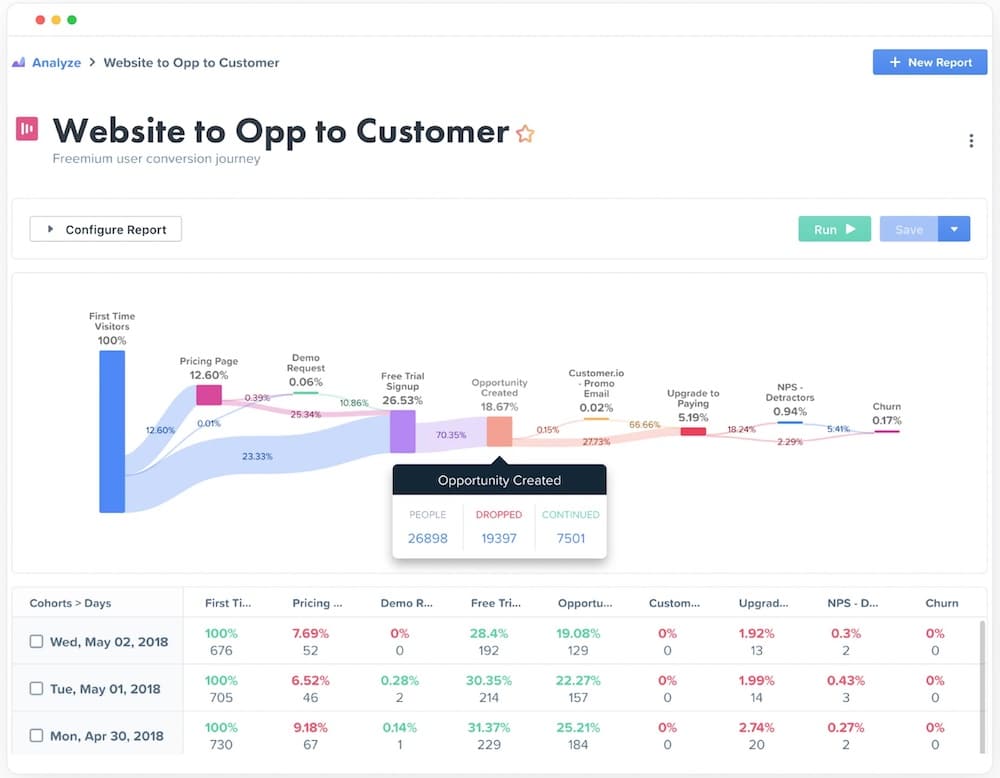
Woopra customer journey analysis dashboard
Like Google Analytics, you can use Woopra to create various reports to gauge metrics. Some reports include:
- Journey Reports: To visualize and analyze how users move through different journeys in your product or website.
- Trends Reports: To track and compare key metrics over time, such as active users, sessions, pageviews, revenue, etc.
- Attribution Reports: To measure the impact of your marketing campaigns and channels on your user acquisition and retention.
- Cohorts Reports: You can group users based on shared characteristics or actions and analyze their behavior over time.
- Retention Reports: To see how often users return to your product or website and what makes them stay.
- People Reports: To explore and segment your user base based on behavior, attributes, or preferences.
- Profiles: View individual-level data for each user in your product or website.
It also lets you take action based on user data, including sending personalized messages, triggering automation, or syncing data with other tools.
What’s more, Woopra provides individual-level tracking, enabling businesses to track and analyze the behavior of specific users in real-time.
Other key features include:
- Dynamic Journeys: Woopra helps you create journeys based on your business goals. You can define the steps and milestones that matter to you, such as signups, activations, conversions, or retention. You can also measure the performance of each journey and identify bottlenecks or opportunities.
- Automation and Triggers: You can set up automation and triggers based on user behavior. This enables personalized messaging, targeted campaigns, and real-time interactions to engage users at the right moment.
Pros:
- Woopra provides real-time analytics, allowing businesses to monitor user behavior and engagement as it happens. This also helps businesses make immediate decisions based on the latest insights.
- Woopra offers extensive integration options with various third-party tools, including CRM systems, marketing automation tools, and customer support platforms. For example, you can connect Woopra with popular platforms like Salesforce, HubSpot, Zendesk, Slack, and more.
- It can create custom segments based on user behavior and attributes.
Cons:
- Woopra may be too complex for some users, especially those unfamiliar with data analysis or customer journey mapping.
- High price point makes it unsuitable for smaller organizations with budget constraints.
Pricing:
Starts at $999 monthly for 5 million actions/month and 2-year data retention. The free plan allows up to 500K actions/mo and 90-day data retention.
4. Kissmetrics
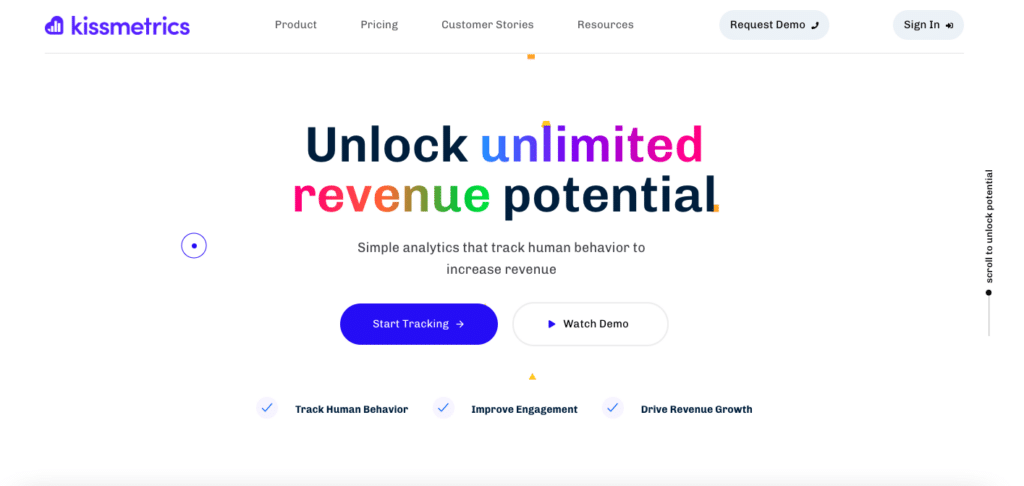
Kissmetrics is an event analytics platform that helps you identify and optimize the metrics that drive your online business. It helps you evaluate and configure all significant metrics like signups, purchases, upgrades, downloads, etc. You can also track custom properties and attributes for each event, like product name, price, category, etc.
What makes it unique is how it goes beyond traditional web analytics by emphasizing customer-centric data and helping you understand the end-to-end customer journey. Kissmetrics does it by tracking and analyzing individual customer behavior rather than focusing on aggregate website data.
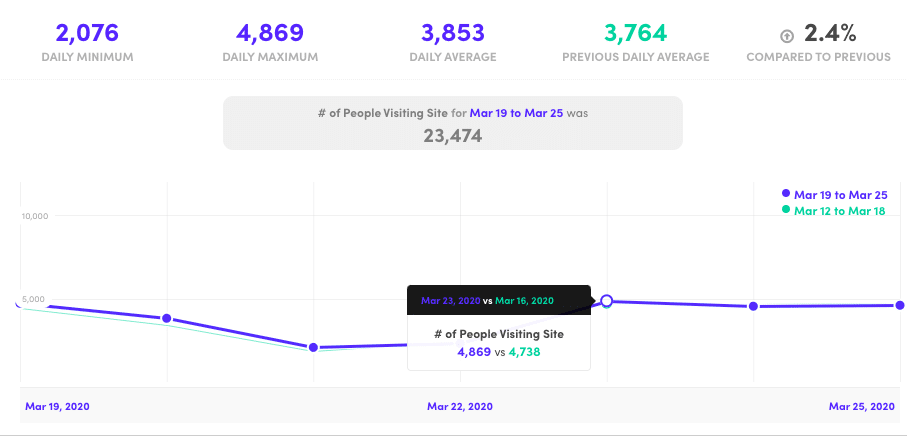
Kissmetrics individual metric detail
Additionally, it lets you create personas and cohorts based on user attributes and behaviors. This helps segment users into groups, allowing targeted marketing campaigns, personalized experiences, and deeper customer insights.
Another standout feature is setting up A/B tests on different user flows or pathways within your website or app. You can define multiple flow variations and measure their impact on conversion rates and revenue.
Pros:
- Kissmetrics enables personalization by helping you deliver targeted experiences based on user behavior.
- It helps you optimize your customer journey, identify areas for improvement, and enhance user experiences.
- It also provides insights into customer lifetime value, allowing you to understand the long-term revenue generated by individual customers.
Cons:
- Some users have reported that the documentation is confusing, and the interface is not always easy to use.
- High pricing can be problematic for small businesses and startups with limited budgets.
Pricing:
Starts at $299 per month for up to 2.5M monthly events and up to 10k monthly tracked users.
5. Heap Analytics
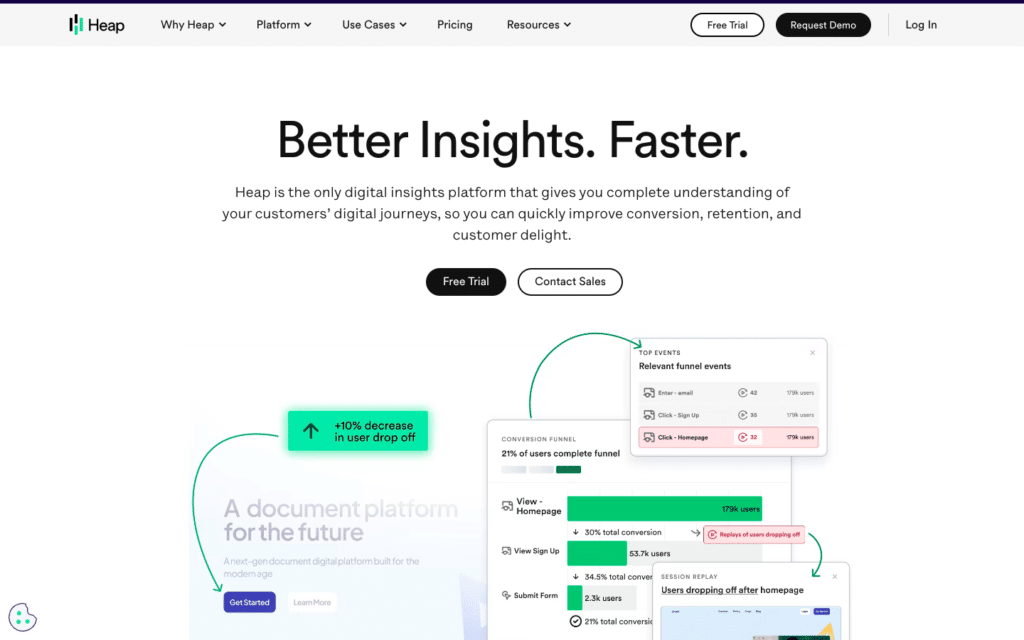
Heap.io is a digital insights platform that helps you understand and improve your customers’ digital journeys to optimize conversion, retention, and overall customer experience.
One of Heap’s unique features includes retroactive analysis, allowing you to change your definitions and metrics retroactively without losing data or breaking your reports.
It also offers event tracking options like signups, purchases, upgrades, downloads, etc. You can also track custom properties and attributes for each event, such as product name, price, and category.
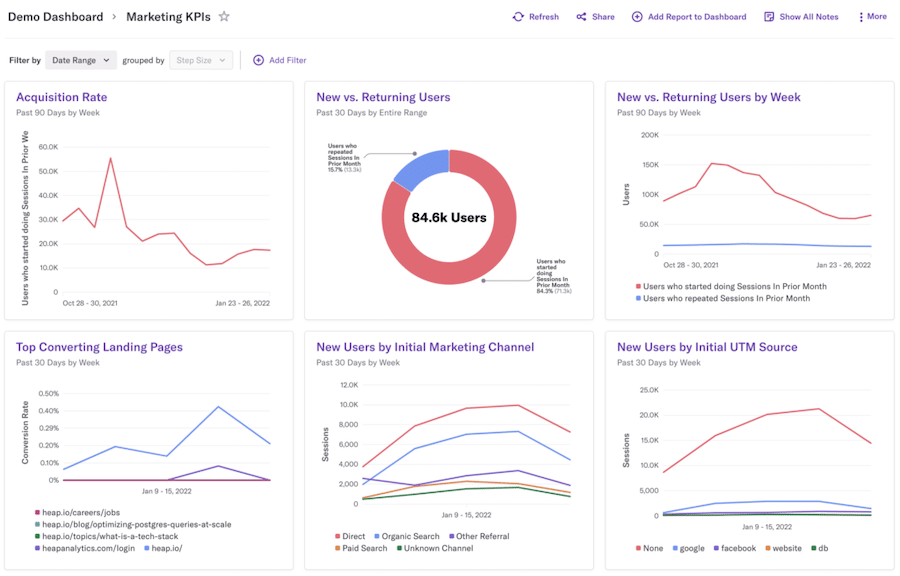

Other key features include session replays, heatmaps, visual customer journeys, funnel analysis, cohort analysis, and more.
Pros:
- Heap.io allows you to segment users based on attributes and behaviors. You can create custom cohorts to compare user groups and analyze their distinct characteristics and actions.
- You can analyze user churn rates, identify factors influencing user retention, and develop strategies to improve user engagement and loyalty.
- Heap.io automates event tracking, eliminating the need for manual event setup.
Cons:
- Heap.io requires some technical knowledge to install and set up on your website or app.
- It can be expensive for small businesses and startups.
Pricing:
Quote-based plans. There’s also a free plan that allows 1 project, standard analysis, and unlimited user licenses.
6. Smartlook
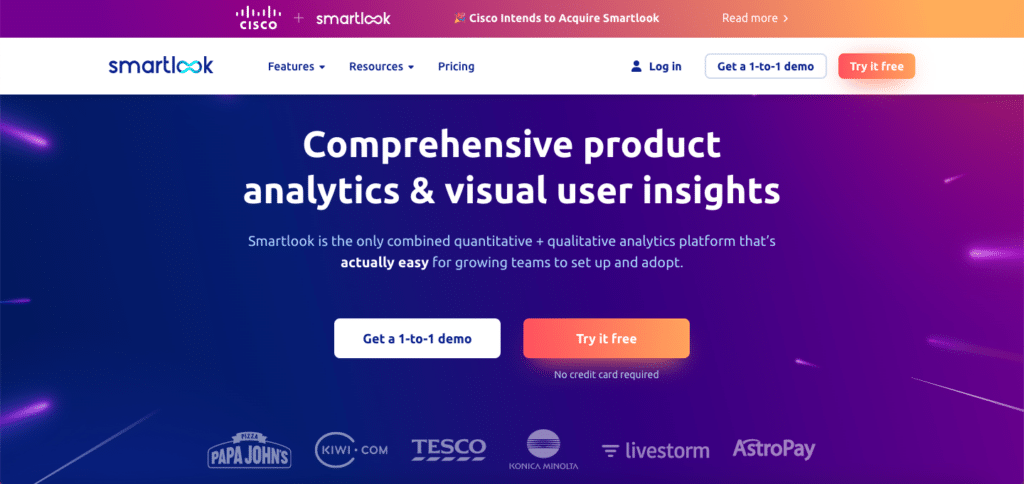
Smartlook is a cross-channel product analytics & visual user insights platform similar to FigPii and Hotjar. It has heat maps and session recordings to help you determine how visitors interact with your website elements.
You can also use funnels and behavior flows to see where visitors leave your website or app without completing their goals.
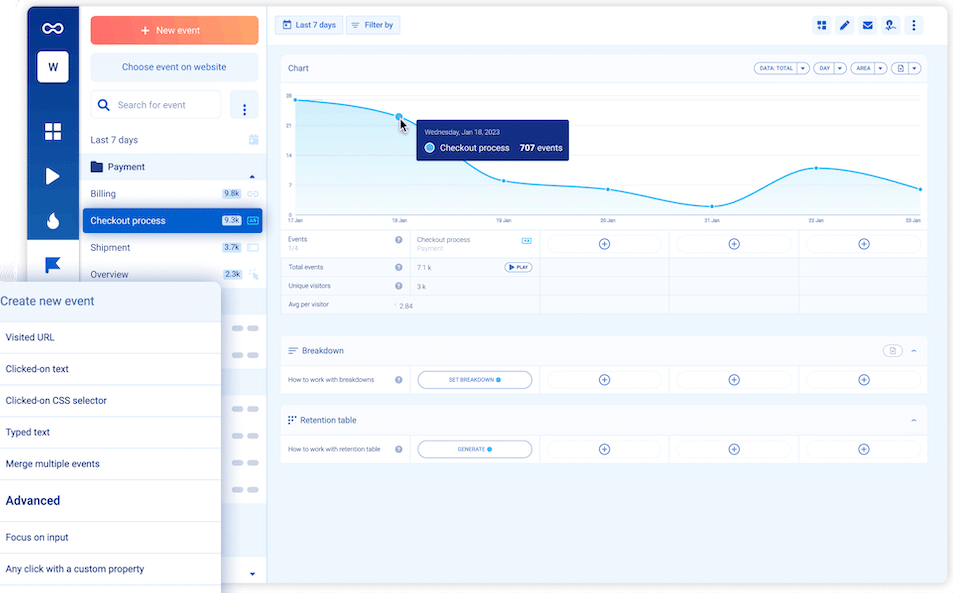
Additionally, Smartlook helps you define and track custom events on your website or app. You can analyze event data to understand user engagement, measure the effectiveness of specific actions, and identify optimization opportunities.
One unique feature that Smartlook offers is the “crash reports” feature that shows you what happened in the moments leading up to a crash in your mobile app. You can watch session recordings of each crash and access stack trace reports for quick bug identification and detailed crash analytics.
Pros:
- It’s an all-in-one conversion optimization platform.
- It’s easy to use and set up. Plus, you can install Smartlook on your website or app with a simple code snippet or plugin.
Cons:
- Smartlook does not offer A/B testing or other advanced features that some users may need.
- The paid plan offers heat maps and sessions.
Pricing:
Starts at $55 per month for up to 5000 monthly sessions, 5 funnels, and 30 heat maps. The free plan allows up to 3000 monthly sessions and only 10 heat maps.
7. Clicky
Clicky is a website analytics tool that helps you monitor, analyze, and react to your traffic in real time. It’s an alternative to Google Analytics that provides more privacy-friendly and GDPR-compliant features, such as no personal data, no tracking cookies, and no bots or referrer spam.
Here’s everything else you can do with Clicky:
- Visitor Analytics: Get information about individual visitors, their location, referral sources, and behavior on your website.
- On-site Analytics: Get insights into page views, bounce rates, average time on site, and popular pages
- Goal Tracking: You can configure goals and track conversions on your website. You can also define specific actions or events as goals, such as form submissions or product purchases, and monitor their completion rates.
- Campaign Tracking: You can add custom tracking parameters to your URLs and monitor the traffic, conversions, and engagement generated by each campaign.
One of its standout features includes uptime monitoring, which alerts you when your website experiences downtime or performance issues. This feature helps you stay informed about the availability of your website and take prompt action to minimize disruptions.
It also offers heatmaps to show where users click the most, how far they scroll, and which areas receive the most attention.
Pros:
- Clicky helps you measure and optimize your website’s performance against specific objectives.
- It’s reasonably priced and also includes a freemium plan.
- It collects data in real-time, allowing you to monitor live traffic, see the sources of your visitors, and track their on-site behavior as it happens.
Cons:
- Some advanced features, such as heatmaps and uptime monitoring, are only available in Clicky’s higher-tier paid plans.
- Clicky has a relatively limited number of integrations compared to other analytics tools.
- The UI is a bit dated and cluttered.
Pricing:
Starts at $9.99 per month for up to 30,000 daily page views. The free plan allows up to 3000 daily page views.
8. Piwik PRO
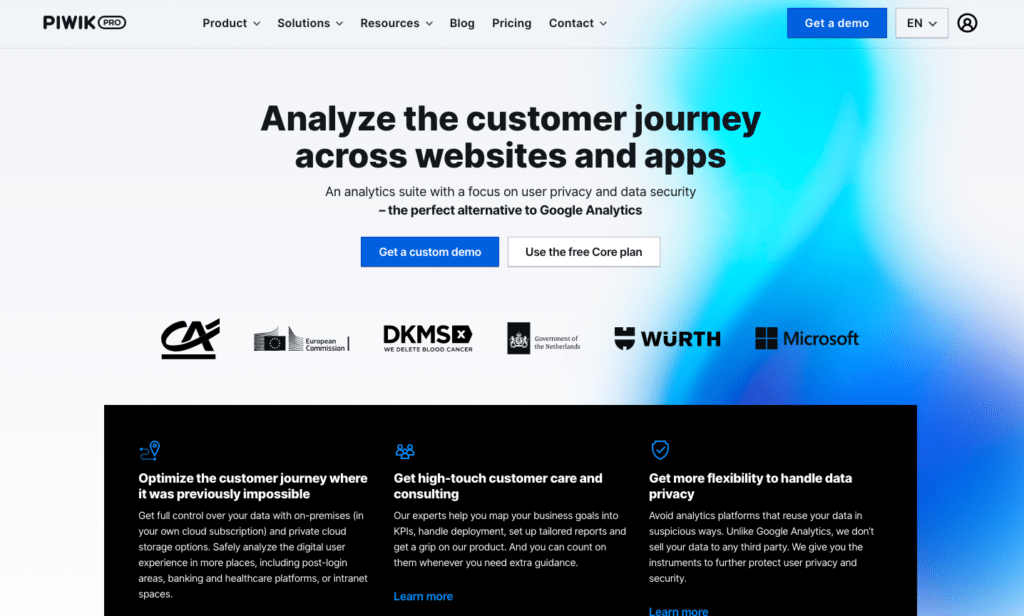
Piwik PRO is a web analytics and marketing platform offering on-premises and cloud-based deployment options. This provides the flexibility to choose the hosting environment that suits your organization’s needs and data privacy requirements.
It also strongly emphasizes data privacy and security – allowing you complete control over your data and ensuring compliance with privacy regulations (such as GDPR). Plus, it offers features like data anonymization, consent management, and data residency options.
Talking of web analytics and reporting features, Piwik PRO provides real-time data tracking and customizable dashboards. You can monitor website performance, track key metrics, and gain insights into user behavior and engagement.
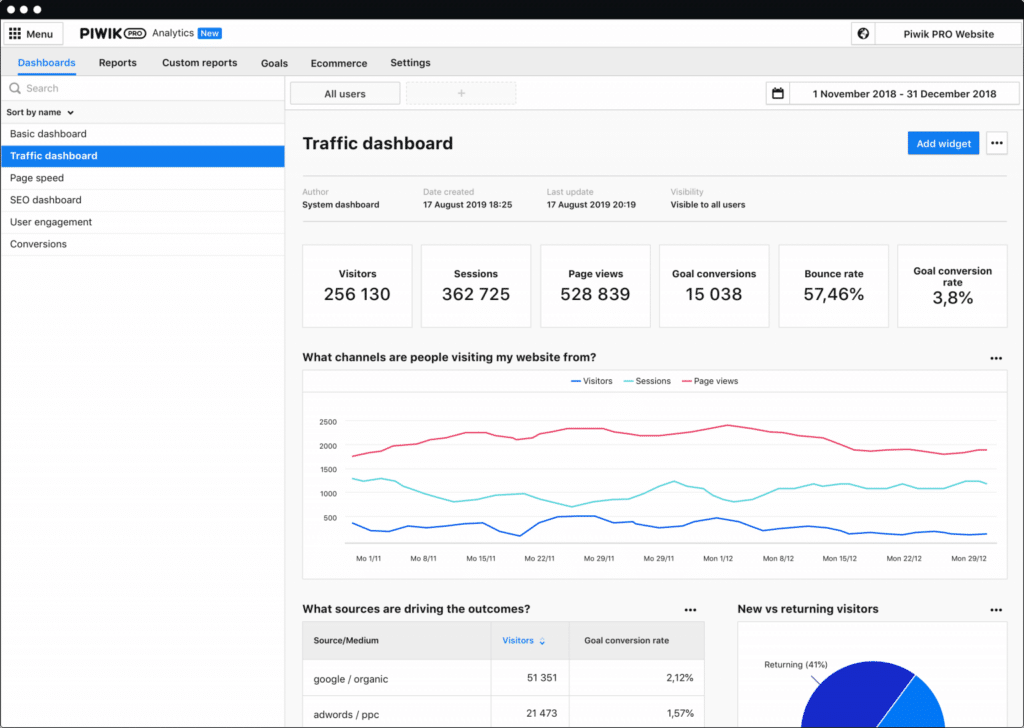
 You can also gauge customer journey analytics, including multi-channel attribution reports, user flow, and conversion funnels.
Pros:
- Piwik PRO allows you to customize and personalize the user experience based on collected data. You can segment your audience, create personalized campaigns, and deliver targeted content to improve engagement and conversions.
- Special emphasis on privacy and data security to ensure user data is protected by encryption, access control, audit logs, anonymization, data retention policies, and more.
Cons:
- The UI could be more modern-looking and intuitive.
- Some users have reported problems with data retention and loading speed when using Piwik PRO.
Pricing:
Quote-based plans.
9. Matomo
Matomo is an open-source analytics platform that offers a self-hosted solution where you have full control over your analytics data. You can host Matomo on your server or choose Matomo Cloud for a managed hosting environment. This self-hosted approach ensures complete data ownership and control.
To ensure data privacy and compliance with GDPR, Matomo provides features like IP anonymization, user consent tracking, and data retention controls.
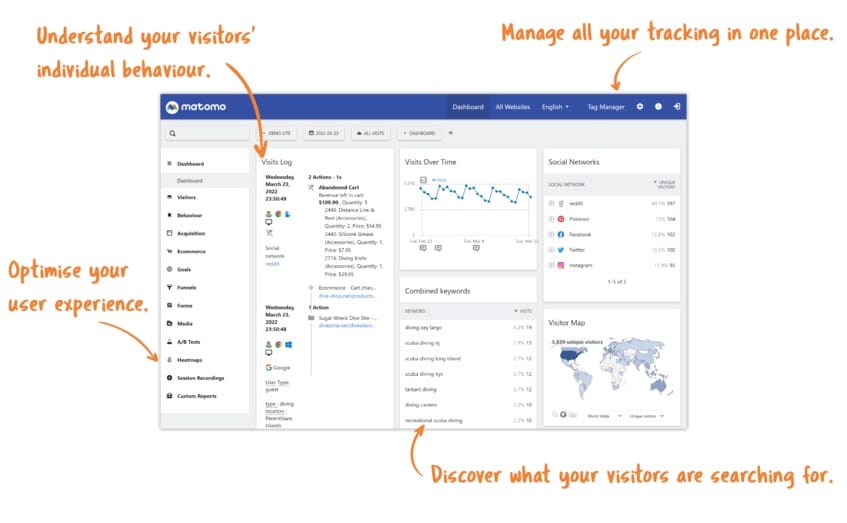
Regarding web analytics, Matomo offers real-time tracking, detailed reports, and customizable dashboards. You can monitor website performance, track visitor behavior, measure key metrics, and generate insightful reports.
Pros:
- Matomo has an active plugin ecosystem, offering a wide range of additional features and integrations. You can extend the functionality of Matomo by installing plugins for specific use cases like heatmaps, form analytics, ecommerce tracking, and more.
- Matomo allows you to segment your website visitors based on demographics, traffic sources, behaviors, or custom dimensions.
- Matomo’s focus on data ownership, privacy, and customization makes it a compelling alternative to Google Analytics.
Cons:
- If you choose the self-hosted option, you’ll be responsible for maintaining and updating your Matomo installation.
- While Matomo has an active community and support forum, it may not have the same resources, documentation, and community support as larger analytics platforms like Google Analytics.
- While Matomo can handle substantial amounts of data, scalability may become a consideration for large enterprises with extensive tracking needs or high traffic volumes.
Pricing:
Open-source platform. You’ll only have to pay if you opt for the cloud-based system.
10. GoSquared
GoSquared specializes in real-time data tracking and visualization, allowing you to see live visitor counts, active pages, and real-time interactions.
It also offers a unique People Analytics feature that provides detailed individual-level data on your website visitors and customers. You can track user activity, engagement, and conversion paths for specific individuals, helping you understand their behavior and personalize their experiences.
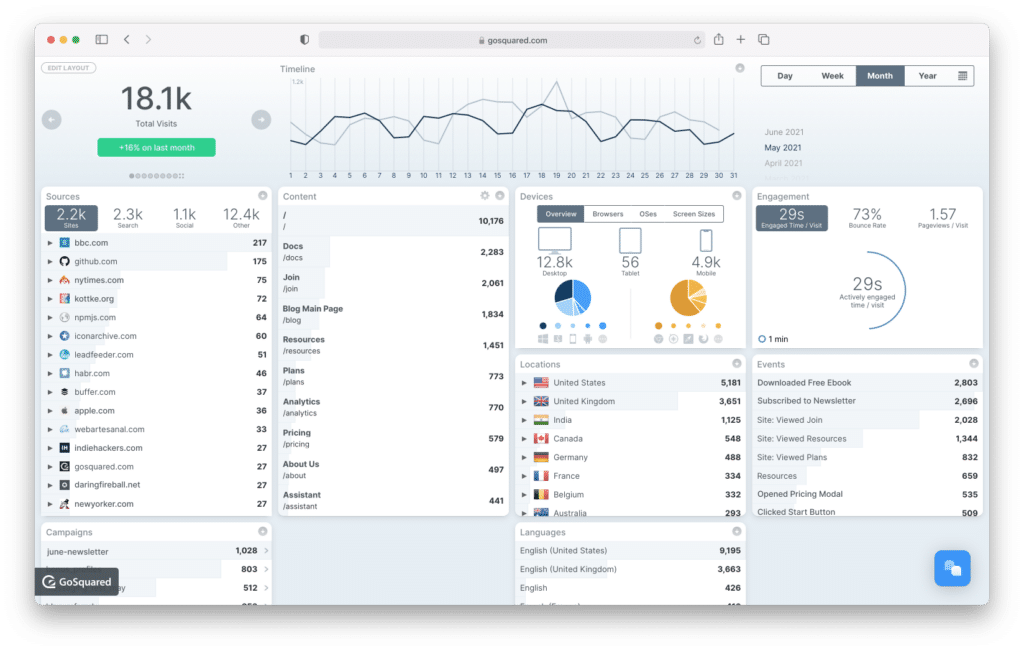
The platform also includes a built-in live chat feature, allowing you to engage with website visitors in real time. You can provide instant support, answer questions, and gather feedback, enhancing the customer experience and improving conversion rates.
Pros:
- GoSquared allows you to track and analyze conversions, attributing them to specific marketing campaigns, channels, or touchpoints.
- You can segment your audience based on demographics, behavior, or custom attributes.
Cons:
- The costs can increase significantly as your website traffic grows.
- Lacks complex segmentation and advanced attribution modeling.
Pricing:
Starts at $9 monthly for up to 100,000 pageviews and three projects. There’s no free plan – but you can try it for free for up to 7 days.
11. Fathom Analytics
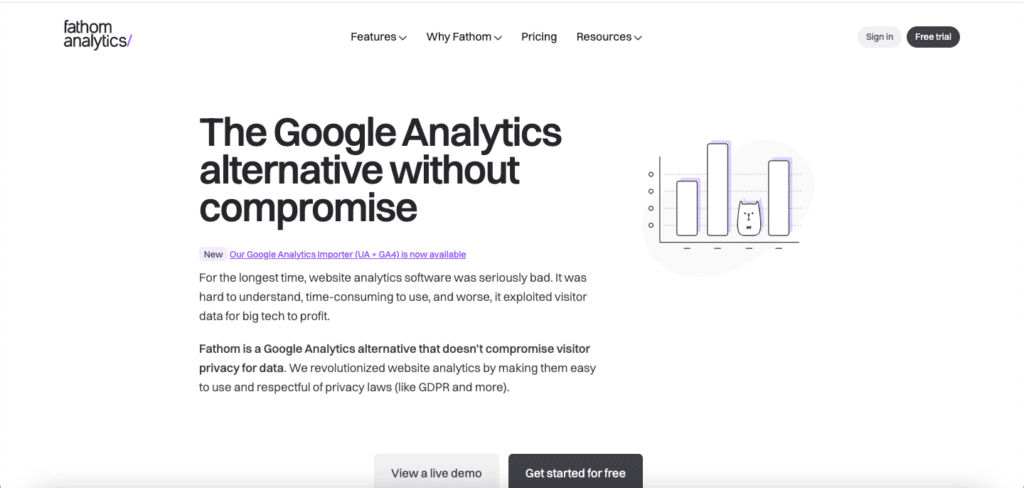
Fathom is another privacy-focused alternative to Google Analytics on this list. It doesn’t use cookies, track personal information, or collect personally identifiable data – while providing valuable website analytics.
Fathom is also a simple and minimalist web analytics platform that shows you only the essential metrics and insights that matter for your website. You can see your page views, visitors, bounce rate, referrers, top pages, goals, and more in a clear, easy-to-understand dashboard.
It also has a special “all-sites view” feature that lets you see every site on your account on a single screen.
Plus, they offer a fast and lightweight script that loads faster than Google Analytics and does not affect your page speed or SEO. Fathom claims its script is smaller than Google Analytics and loads faster.
Pros:
- Fathom’s focus on privacy, simplicity, and transparency makes it an attractive alternative to Google Analytics.
- It’s fast and lightweight, making your site load optimally.
Cons:
- Fathom analytics only shows a limited set of metrics and dimensions. It does not support A/B testing, attribution modeling, or event tracking.
Pricing:
Starts at $14/m for up to 100,000 monthly page views. There’s also a 30-day free trial.
Unleash Your Data Potential with These Google Analytics Alternatives!
While Google Analytics has long been the go-to platform for web analytics, now that it’s shutting down and they’re introducing Google Analytics 4, the time has come to explore a new path.
It will also be a great idea to look for alternatives that offer greater privacy, flexibility, and a fresh perspective on data analysis.
Privacy-focused solutions like Fathom offer peace of mind in safeguarding user data while delivering essential analytics.
Specialized platforms such as Mixpanel, Kissmetrics, or Optimizely bring unique features tailored to specific needs, empowering businesses to dive deeper into customer behavior and optimize their strategies.
Businesses can also paint a complete picture of their online presence using a visual website optimization and user behavior tool like FigPii.
Ultimately, the choice is yours. Before picking your web analytics tool, you must consider your data visualization goals, needs, budget, and preferences. You also need to weigh the pros and cons of each option and see how they fit your website.